Wednesday, December 14, 2016

You Do The Math - Post War Baby Boomers

Yet another example of how liberals can't do math.  They blame the increase in population after World War Two on the sudden decline in the labor force participation rate, due to the sudden increase in retirees 55 and 63 years later.

Here's the graph showing that employment is at a 40 year low.
Notice the sudden decline in 2001 and 2008?


And here is the graph showing the US population growth.  Notice that there are more people every year?


So, quick question: If there are twice as many people now, than in 1950, how can the current number of workers have trouble paying for the retirees' Social Security payments?  

OK, so that's an aside.  The original question is about the unemployment rate.  If we have MORE people every year, then how can the unemployment rate ever go up?  Well, there would have to be slower job creation than baby creation.

This is either caused by a poor economy or immigrants that are children (like Obama's 100,000 unaccompanied minors from Latin America). It could also be caused by immigrants that are on welfare or are retired.  The former is a well known fact.  I've never heard of the latter.

Another interesting phenomenon is that the post war baby boom actually kept happening and has never stopped.  The rate of increase in population made a sudden change to the positive after the Great Depression in 1940, again in 1950, and again in 1990.  You can see that more easily when we zoom in and place some marks on the chart to highlight the point in time where it changes.


This rate of growth is the slope of the curve.  Here I tried to show a green rate (safe), a blue rate (warning), a yellow rate (danger), and a red rate (we are f'd).


This ever increasing slope of the curve means that the post war baby boom is an ongoing thing.  Not hardly.  My three aunts had kids after the war when their husbands returned from the war.  They had kids for five to twelve years each.

One aunt had two kids, another had four, and a third had nine.  But, even this prolific aunt stopped having kids before 1960.  She didn't have kids from 1946 to 2016.  That's 70 years.  Her uterus would have fallen out long before that!  Besides that, she died of old age in 2008.

So, this "baby boom" is an ongoing thing.  There should be no sudden drop in employment starting in 2001, nor another sharp decline starting in 2008.

What's interesting is that these sudden drops in employment coincide with two stock market bubble bursts.  The first was tech stocks and internet stocks.  The second was the housing bubble burst.  (My stock dropped 67% between 2007 and 2008, and didn't come back for about five years.)

The 2001 drop in employment also coincided with 9/11, the destruction of the World Trade Center, the big crunch to the airline industry, and the start of (our involvement in) the war on terror, and the invasions of Afghanistan and Iraq.

These economic coincidences make much more sense than a NONEXISTENT, short term, baby boom after World War Two.

Monday, August 22, 2016

You Do The Math - Rio Medal Count

Sure, the US usually wins the medal count, but that's because we have over 320 million residents, twice that of Russia, and five times that of Britain.  However, China and India have 1.3 to 1.4 BILLION, shouldn't they always beat our pants off?

Here's where I get my data.


So, who has the most medals "per capita"?  New Zealand and Jamaica are darn high up there, around 4 medals per million residents, Denmark is at 2.5 medals per million, and many have over 1 medal per million.  Even Norway beats us, despite being the most northern country, or close to it.


In fact, most industrialized countries whup our butts.  Somebody needs to Make America Great Again!  Gee, I wonder who.


And who is really doing poorly?   China has 1/20th, Nigeria has 1/180th, and lowly India with 1/626th of a medal per million people.

Here's what I had time for today.  More to come.

(Keep in mind, 10 or 20 million of US residents are illegal, and probably can't compete, so the US actually did beat Russia in the "per capita" category with 0.39 to their 0.38 medals per million.)


RIO GAMES
                                                                        Total      Population  Medals
Rank Country             Gold Silver Bronze Medals  in millions   per Capita
1        United States      43      37       38       118        321.4           0.37
2        Great Britain        27      22      17         66           64.1          1.03
3        China                    26      18       26        70      1,367.5          0.05
4        Russia                  18      17       19        54         142.4          0.38
5        Germany              17       10       15       42            80.8         0.52
6        Japan                   12        8        21        41         126.9         0.32
7        France                    9        17      14        40           66.5         0.60
8        Korea                      9        3          9        21           49.1         0.43
9        Australia                8        11       10        29          22.8         1.27
10        Italy                      8        11         7        26           61.9        0.42
11        Netherlands        8        6          4        18
12        Hungary              8        3          4        15
13        Spain                   7        4          4        15
14        Brazil                   6        6          6        18            204.2        0.09
15        Kenya                  6        6        1        13                45.9        0.28
16        Jamaica             6        3        2        11                   2.9        3.79
17        Croatia                5        3        2        10
18        Cuba                    5        2        4        11
19        New Zealand      4        9        5        18                  4.4        4.09
20        Canada                4        3       15       22                 35.1       0.63
21        Kazakhstan        3        5        9        17                  18.2      0.93
22        Colombia            3        2        3        8
23        Iran                      3        1        4        8
24        Greece                3        1        2        6
25        Argentina           3        1        0        4
26        Sweden              2        6        3        11                     9.8       1.12
27        South Africa      2        6        2        10
28        Ukraine              2        5        4        11
29        Poland               2        3        6        11
30        North Korea       2        3        2        7
30        Serbia                 2        3        2        7
32        Uzbekistan         2        2        5        9
33        Belgium              2        2        2        6
33        Switzerland         2        2        2        6
33        Thailand              2        2        2        6
36        Slovakia               2        2        0        4
37        Georgia                2        1        4        7                 4.9       1.43
38        Denmark             1        6        7        14               5.6       2.50
39        Azerbaijan           1        4       10       15              9.8       1.53
40        Belarus                 1        4        4        9
41        Turkey                   1        3        4        8
42        Armenia                1        3        0        4
43        Ethiopia                1        2        5        8
44        Slovenia                1        2        1        4
45        Indonesia              1        2        0        3
46        Czech Republic    1        1        7        9
47        Romania               1        1        2        4
48        Bahrain                  1        1        0        2
48        Vietnam                 1        1        0        2
50        Chinese Taipei      1        0        2        3
51        Bahamas               1        0        1        2
51        Côte d’Ivoire          1        0        1        2
51        IOA                         1        0        1        2
54        Fiji                          1        0        0        1
54        Jordan                   1        0        0        1
54        Kosovo                   1        0        0        1
54        Puerto Rico            1        0        0        1
54        Singapore               1        0        0        1
54        Tajikistan                1        0        0        1
60        Malaysia                  0        4        1        5
61        Mexico                      0        3        2        5              127.1      0.039
62        Algeria                        0        2        0        2
62        Ireland                        0        2        0        2                4.9       0.41
64        Lithuania                    0        1        3        4
65        Bulgaria                      0        1        2        3
65        Venezuela                   0        1        2        3
67        India                             0        1        1        2       1,251.7     0.0016
67        Mongolia                     0        1        1        2
69        Burundi                        0        1        0        1
69        Grenada                       0        1        0        1
69        Niger                             0        1        0        1
69        Philippines                   0        1        0        1
69        Qatar                             0        1        0        1
74        Norway                         0        0        4        4               5.2      0.769
75        Egypt                             0        0        3        3
75        Tunisia                          0        0        3        3
77        Israel                             0        0        2        2                8.0     0.25
78        Austria                          0        0        1        1
78        Dominican Republic   0        0        1        1
78        Estonia                          0        0        1        1
78        Finland                          0        0        1        1
78        Morocco                        0        0        1        1
78        Moldova                         0        0        1        1
78        Nigeria                            0        0        1        1         181.6      0.006
78        Portugal                          0        0        1        1
78        Trinidad and Tobago     0        0        1        1
78        United Arab Emirates    0        0        1        1
-        Afghanistan        0        0        0        0
-        Albania        0        0        0        0
-        American Samoa        0        0        0        0
-        Andorra        0        0        0        0
-        Angola        0        0        0        0
-        Antigua and Barbuda        0        0        0        0
-        Aruba        0        0        0        0
-        Bangladesh        0        0        0        0
-        Barbados        0        0        0        0
-        Belize        0        0        0        0
-        Benin        0        0        0        0
-        Bermuda        0        0        0        0
-        Bhutan        0        0        0        0
-        Bolivia        0        0        0        0
-        Bosnia and Herzegovina        0        0        0        0
-        Botswana        0        0        0        0
-        British Virgin Islands        0        0        0        0
-        Brunei        0        0        0        0
-        Burkina Faso        0        0        0        0
-        Cabo Verde        0        0        0        0
-        Cambodia        0        0        0        0
-        Cameroon        0        0        0        0
-        Cayman Islands        0        0        0        0
-        Central African Republic        0        0        0        0
-        Chad        0        0        0        0
-        Chile        0        0        0        0
-        Comoros        0        0        0        0
-        Congo        0        0        0        0
-        Congo (DRC)        0        0        0        0
-        Cook Islands        0        0        0        0
-        Costa Rica        0        0        0        0
-        Cyprus        0        0        0        0
-        Djibouti        0        0        0        0
-        Dominica        0        0        0        0
-        Ecuador        0        0        0        0
-        El Salvador        0        0        0        0
-        Equatorial Guinea        0        0        0        0
-        Eritrea        0        0        0        0
-        Gabon        0        0        0        0
-        Gambia        0        0        0        0
-        Ghana        0        0        0        0
-        Guam        0        0        0        0
-        Guatemala        0        0        0        0
-        Guinea        0        0        0        0
-        Guinea-Bissau        0        0        0        0
-        Guyana        0        0        0        0
-        Haiti        0        0        0        0
-        Honduras        0        0        0        0
-        Hong Kong SAR        0        0        0        0
-        Iceland        0        0        0        0
-        Iraq        0        0        0        0
-        Kiribati        0        0        0        0
-        Kuwait        0        0        0        0
-        Kyrgyzstan        0        0        0        0
-        Laos        0        0        0        0
-        Latvia        0        0        0        0
-        Lebanon        0        0        0        0
-        Lesotho        0        0        0        0
-        Liberia        0        0        0        0
-        Libya        0        0        0        0
-        Liechtenstein        0        0        0        0
-        Luxembourg        0        0        0        0
-        Macedonia, FYRO        0        0        0        0
-        Madagascar        0        0        0        0
-        Malawi        0        0        0        0
-        Maldives        0        0        0        0
-        Mali        0        0        0        0
-        Malta        0        0        0        0
-        Marshall Islands        0        0        0        0
-        Mauritania        0        0        0        0
-        Mauritius        0        0        0        0
-        Micronesia        0        0        0        0
-        Monaco        0        0        0        0
-        Montenegro        0        0        0        0
-        Mozambique        0        0        0        0
-        Myanmar        0        0        0        0
-        Namibia        0        0        0        0
-        Nauru        0        0        0        0
-        Nepal        0        0        0        0
-        Nicaragua        0        0        0        0
-        Oman        0        0        0        0
-        Pakistan        0        0        0        0
-        Palau        0        0        0        0
-        Palestinian Authority        0        0        0        0
-        Panama        0        0        0        0
-        Papua New Guinea        0        0        0        0
-        Paraguay        0        0        0        0
-        Peru        0        0        0        0
-        Refugee Olympic Team        0        0        0        0
-        Rwanda        0        0        0        0
-        Saint Kitts and Nevis        0        0        0        0
-        Saint Lucia        0        0        0        0
-        Saint Vincent and the Grenadines        0        0        0        0
-        Samoa        0        0        0        0
-        San Marino        0        0        0        0
-        Saudi Arabia        0        0        0        0
-        Senegal        0        0        0        0
-        Seychelles        0        0        0        0
-        Sierra Leone        0        0        0        0
-        Solomon Islands        0        0        0        0
-        Somalia        0        0        0        0
-        South Sudan        0        0        0        0
-        Sri Lanka        0        0        0        0
-        Sudan        0        0        0        0
-        Suriname        0        0        0        0
-        Swaziland        0        0        0        0
-        Syria        0        0        0        0
-        São Tomé and Príncipe        0        0        0        0
-        Tanzania        0        0        0        0
-        Timor-Leste        0        0        0        0
-        Togo        0        0        0        0
-        Tonga        0        0        0        0
-        Turkmenistan        0        0        0        0
-        Tuvalu        0        0        0        0
-        U.S. Virgin Islands        0        0        0        0
-        Uganda        0        0        0        0
-        Uruguay        0        0        0        0
-        Vanuatu        0        0        0        0
-        Yemen        0        0        0        0
-        Zambia        0        0        0        0
-        Zimbabwe        0        0        0        0
Data from PERFORM · All times are Eastern Standard Time

Friday, January 1, 2016

You Do The Math - Black Prison Population

So I'm watching a Comedy Central “roast” of sorts, taped in a prison. The comedian dares to dis’ a bunch of hardened criminals. (Well… at least one of them said he might be violent.) And of course the captions on the bottom of the screen have to simultaneously scroll facts like you’re watching a CNN report on a Netanyahu and Arafat accord while multitasking the scroll describing a class action lawsuit on some pharmaceutical’s boner pill. (Which you would need after that watching the news.)


Back to the Comedy Central scroll. It said two things. The first was that 1 out of every 100 US residents are in prison. That means 3.2 million of the 320 million residents are in prison. Here's the 2014 US population from the Census Bureau, listed in the World Almanac.


About 319 million in the middle of 2014. It's certainly 320 million now, Jan 1st of 2016, since Obama has legal immigration over 400,000 a year, and isn't enforcing visas and borders.

 Notice I didn't say “citizens”? That's because when I worked Census 2000 we didn't care if you were legal or not. We were not ICE, we were trying to determine who and where to spend the tax dollars the IRS took from citizens.

 The scroll also said prison, not jail. So I looked up the stats in the World Almanac, and they get them from the DOJ. Yes, the Department of Justice. Obama’s DOJ. Eric Holder’s DOJ.


 That’s only 1.6 million in state and federal prison. But 1.6 million is exactly half of 3.2 million. Oooops!

 So, turn the page. The next stat from the UN Office On Drugs And Crime probably includes city and county jails as well as state and federal prisons. Will it double?


 Nope, it's only 2.2 million. That's 2/3rds of 3.2 million. Oooops again.

 Now back to the scroll. The next factoid says that the number of blacks in prison (and jail, I assume) equals the number of slaves at the start of the Civil War. Well, I've read from different sources that the US had between 4 million and 8 million slaves at that time. This website says 8 million.

Http://www.theroot.com/articles/history/2012/10/how_many_slaves_came_to_america_fact_vs_fiction.html

 But the Census Bureau says 4 million.


Either way, that’s a LOT more than 2.2 million. Oooops again.

But, not ALL 2.2 million incarcerated are black, are they? There can't possibly be THAT much white-guilt (ooops, I meant to say institutional-racism) can there? Just how many blacks are in prison and jail nowadays? The World Almanac uses stats from the same UN, here it is.


 Obviously, 498 thousand is a lot less than the 4 million or 8 million slaves in 1862. That's under half a million out of the under 40 million blacks currently in the US. One out of eighty. That's a lot less than some other stats I’ve heard over the years, such as 1 out of 3.  Oooops again!

 Here’s the black population at 12.2% in 2010.
12.2% of 320 million is 39 million


 However, it is interesting that the above website on slavery says the US imported about 450 thousand slaves from Africa from 1500 to 1807 or so when it was made illegal. That's pretty close to the number of blacks currently in prison.

But, from 1790 to 1860 things were a whole lot different.  The population grew from 4 million to 31 million people.


When the US won its independence the total population was about the same as the current US prison and jail population.  Amazing, isn't it?

The entire US population at the start of the Civil War was about how many are in California today.


In fact, in 1860 we didn't all have bullets, paved roads, engines, motorcycles, cars, high-rises, electricity, telephones, refrigeration, indoor plumbing, clean water, planes, radio, computers, TV, satellites, printers, fax machines, copiers, the internet, space ships, satellites or this smart phone I can use to blog across the world in mere seconds. It's all relative, and if it’s a stat from Comedy Central, it's “relatively” accurate, in other words, inaccurate. Even Fox News is more accurate than that.


Tuesday, December 29, 2015

You Do The Math - Turn Off Your Christmas Lights

Liberals have apparently grown tired of claiming Christians are evil, maybe because Jesus was such a gender-fluid guy, according to Sarah Silverman. I'd like to gender fluid all over her next meal, that's how I feel about her ridiculous pro-abortion-Jesus skit she did last year. But what have the liberals chosen as a new target? Christmas lights!


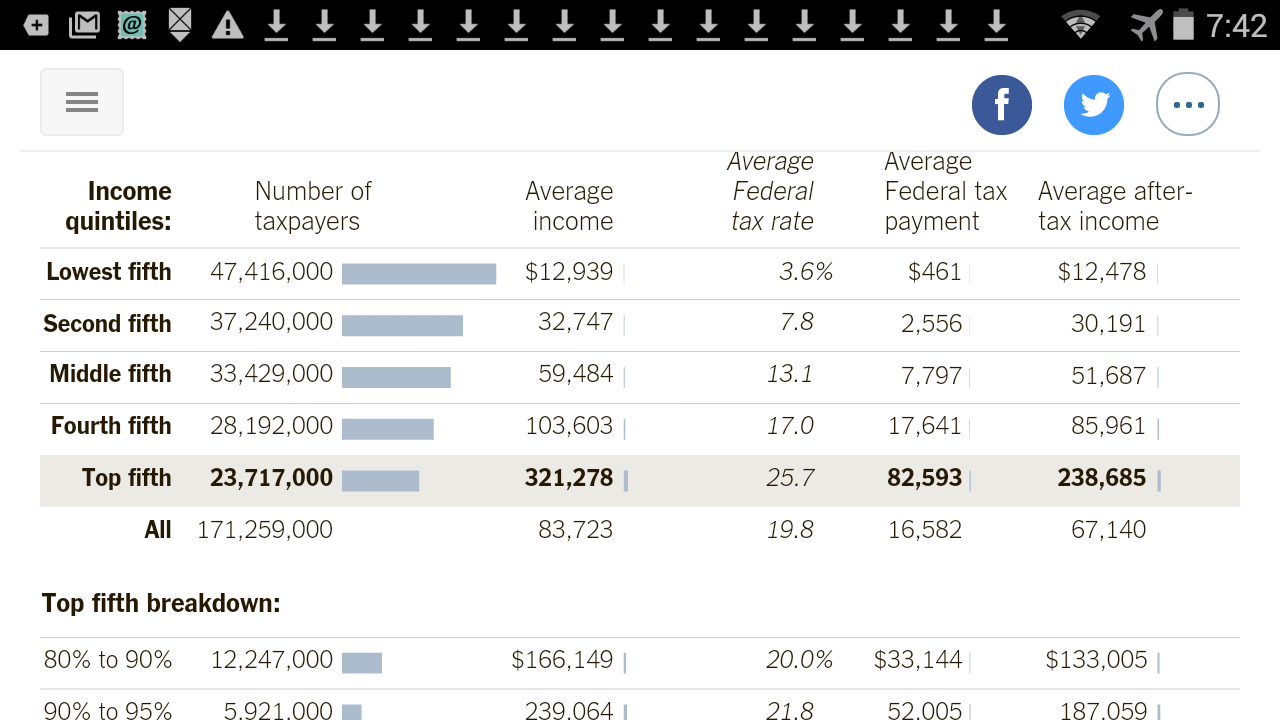
 And two such liberals (Todd Moss and Priscilla Agyapong) are quoting a 2008 EPA study claiming that Christmas lights use a whopping 6.6 billion kilowatt-hours, or a miniscule 0.2% of the nation's electricity use, according to the same study.

 Before getting into much math, I wonder if Todd and Priscilla have a big flat-screen TV that uses 125 watts, or maybe a modern computer system that uses 250 watts? Compare that to a tree with five 5 watt strands of LED Christmas lights totalling 25 watts. Without a calculator, you can deduce they use 5 to 10 times more denial than the average Christian. Is it denial or just ignorance? Either way, it all ends up as hypocrisy.


 Skipping the math (and looking at the back of the blog) a Christmas tree with five strands of LED lights, using a miniscule 5 watts each, running 14 hours a night for 30 nights, together use about 3,500 times less energy than someone on the slightly higher end of the transportation sector, getting 20 miles per gallon and driving 20,000 miles a year. That's almost ten times less than the 0.2% figure, a touch less than 0.03%

On the other end of the scale, compare a huge, 500 watt Christmas display (that the local news claims to exist) to a 40 mpg car driven only 10,000 miles a year. This Christmas display uses 2.3% of the energy of the car.

 The EPA study adds that this 6.6 billion kw-hr of energy could run 14 million refrigerators. Well, it could run 7.5 trillion refrigerators, one for every person in Earth, but only for 55.6 seconds.

Joe Johnson's Ford F650 probably uses as much energy as 14,000 Christmas displays


 Here's a website that provides monthly energy consumption of all the things in and around your home, from swimming pools to a satellite box.

Https://www.efficiencyvermont.com/For-My-Home/ways-to-save-and-rebates/Appliances/Refrigerators/General-Info/Electric-Usage-Chart


 Looking at all six refrigerstors at this site, the newest and most energy efficient refrigerator uses 41 kw-hrs a month, while a 20 year old frige with a bit more cubic feet uses 135. Dividing 135 by 41 in our head we see that the newer and smaller frige uses about 3.28 times less energy.

Dividing 6.6 billion kw-hr by 14 million and dividing again by 135 gives 3.5 months of operation for these 14 million energy hogging refrigerators. The most efficient would run for 11.5 months. Now you get the idea of the difference between energy and power.

 Energy is like a lump of coal or a gallon of gas. Power is how quickly you burn it. Both a 600 horsepower Corvette and a 150 horsepower Cavalier can have 10 gallons of gas in their tank. Both will have 10 times 36.6 kilowatt-hours of energy at their disposal. However, we all know a 600 hp engine will blow through that gas 4 times faster than the 150 hp engine.


 And since we all love cars so much, and we can all relate to driving much more easily than heating our homes, and because cars can sometimes be run on electricity (be it from coal or gasoline), then we'll use the nation's gasoline consumption as a comparison to Christmas lights. Moreover, the transportation sector uses about the same amount of energy as residential homes, 28% vs 21%, respectively, of the total US energy usage (in 2007).

The EPA study cited by Moss and Agyapong was a 2008 study, and the closest I have is the 2009 World Almanac with 2006 stats from the US DOT, the American Petroleum Institute, the Federal Highway Administration and the Insurance Institute for Highway Safety.

 The US average for miles driven was 14,862 per licensed driver and 12,345 per registered vehicle. The average miles per gallon was a paltry 16.76 mpg and the number of gallons used per vehicle was 737 gallons. There were 816 vehicles per 1,000 residents.


 The US population was 301,621,157 in 2007 according to the US Census Bureau. To arrive at a good number for 2006, we can simply extrapolate. In 2000 the population was 281,421,906 according to the census. Simply find the difference between 2000 and 2007, divide by 7, and subtract that number from the 2007 population to find the 2006 population.

 (301,621,157 - 281,421,906) / 7 = 2,885,607
 301,621,157 - 2,885,607 = 298,735,550 residents

 With 816 vehicles per 1000 residents, we get 243,768,209 vehicles. Multiply 737 gallons by 243,768,209 vehicles and we get 179,657,200,000 gallons. That's about 180 billion gallons.


 If Christmas lights used 6.6 billion kilowatt-hours, simply divide by the energy per gallon of gas to get the equivalent amount of gasoline the Christmas lights consumed (assuming 100% conversion efficiency).

6.6 billion kw-hrs / 36.6 kw-hrs = 180,327,869 gallons

 It's easy math to see that 180 billion divided by 180 million is a thousand. Therfore, registered vehicles used 1000 times more energy than Christmas lights, assuming their energy source (usually coal) is converted to electricity at 100% efficiency.

 But, that's not the case. According to some research I did for another blog (CFL lights and mercury emissions) I discovered that coal fired power plants operate somewhere between 22% and 32% efficiency, depending on the type of coal they purchased. Basically, somewhere between 1/5th and 1/3rd the energy in coal actually reaches your outlet.


 This knocks your 1000x factor down to the 220 to 320 range. We'll split the difference and go with 270. That means the average vehicle used 270 times more energy than the average Christmas light display.

 Instead of a national average, let's go with some specifics. Let's say a hypocrite liberal in her SUV or minivan averages 20 mpg and drives 20,000 miles a year. That's 1,000 gallons. Let's also consider those of you who use only 500 gallons (10,000 mi @ 20 mpg, 20,000 mi @ 40 mpg, or 15,000 @ 30 mpg).

Divide by, say... 333 driving days a year (assuming you have weekends off, holidays off, an couple weeks off) and you get 3 gallons a day for the high end of the scale, and 1.5 gallons a day for the low end. Multiply that by the 36.6 kw-hrs per gallon, and you use about 100 or about 50 kw-hrs a day.


Compare that to what I heard on the news, that a big Christmas display uses 500 watts. That's about 100 strands of LEDs using 5 watts each. Five watts of LED lights is about as bright as a 60 watt incandescent bulb. That's a BIG display. That would run a 1000 watt microwave oven for 30 minutes of every hour. That's a LOT. That would heat your home.

 Multiply 500 watts by about 14 hours of dark per day (at my latitude of 40 degrees, about that of most of the population of the lower 48, I have 13.5 hours). That comes to 7 kw-hrs a night. That's a lot less than the 50 or 100 your car uses in a day.

But, we were using a 500 watt Christmas display. How about a more normal display, like a Christmas tree with five strands of LED lights using 5 watts each? That's 25 watts and is 20 times less power than a 500 watt display. So, 7 kw-hrs a night drops to 7/20ths, or about 1/3rd of a kw-hr.


The SUV (or pickup or van) at 100 kw-hr a day uses 300 times more energy than that. The same vehicle driven half as much (or the 30 and 40 mpg vehicles described above) use 150 times more energy each day. Multiply by 12 months and the vehicle uses either 3600 times more energy, or 1800 times more.

Switching back to annual usage...

 Let's assume your HUGE Christmas display runs 30 days a year. That's 210 kw-hrs. Compare that to 1000 gallons of gas, which would be 36.6 Megawatt-hours.

 36.6 Megawatt-hrs / 210 kw-hrs = 174

 Basically, an average US personal vehicle getting 20 mpg, driven about the most miles per year as anyone, uses 174 times more energy as a HUGE Christmas display does in a month.

 However, what about the person who drives half as many miles (10,000) or gets twice the gas milesge (40 mpg), or drives 15,000 miles at 30 mpg? Their car uses 87 times more energy than a huge Christmas display.

I'll bet Angie Harmon has ten times the class of Sarah Silverman

What about us normal people? We don't put up 100 strands of 5 watts each. Maybe we do about 5 strands? That's 20 times less energy. So, our car would use 174 times 20 times more energy, or about 3500 times more energy.

James Harrison's Smart Car probably gets 40 mpg

Of course, if that person got 40 mpg or only drove 10,000 miles, cut that factor in half: 3500 / 2 = 1750

 Now, how about a true environmentalist like myself, and not some hypocrite liberal in a regular car or pickup? People like me ride bicycles, or drive cars that get Prius-like mpg, or ride motorcycles that get 60, 70 or 80 mpg. And we probably drive 5,000 to 10,000 miles a year.


All in all, people like me use between 125 and 250 gallons of gas a year. Therefore, that 1750 figure drops to a half or a fouth of that: 875 and 437. Even us fuel mizers use 500 to 1000 times more energy in our vehicles than our moderate-sized Christmas display.

 If you feel guilty about your 500 watt Christmas display, you could easily make up for that by driving a little less, riding a bike once a week, opening your home's windows to heat and cool the place, or turn off the liberal news on TV and play a board game.

Friday, December 18, 2015

You Do The Math - Go Paperless

How many times does your credit card bill have a little ad printed right there on the bill that says, "Go paperless - pay online"?  Every month.  But, how many times does a catalog have such a prominent ad?  Rarely.  But they have no problem sending me a new catalog every month!

From mid August to early December, less than 4 months, they sent me about this many catalogs.  I recycled a couple dozen, so this stack doesn't fairly represent the massive quantities of paper spent on sales and marketing.


To be fair, a credit card only makes between 2% and 3% of the money you spend on a retail item.  (A tiny fraction of what the government makes.). So, is the stack on the right only 2.5% of the stack on the left (plus a couple dozen more catalogs)?

What's 2.5% of 5 pounds?  That's 5 times 2.5 divided by 100.

5 * 2.5 = 12.5

So, we get 0.125 pounds, which is 1/8th, so an eighth of  16 ounces equals 2 ounces.  Well, each letter from the credit card company probably weighs an ounce, so 4 months times 2 bills times 1 ounce equals 8 ounces.

OK, so the credit card companies might be paying a bit more than their fair share in paper costs.  (Remember, I already recycled a couple dozen catalogs.)

Also, this year I received far fewer catalogs than usual.  I guess I didn't spend enough on them last year.

Which brings me to the real point of this blog.  If a company can make money by sending you paper products in the mail (or otherwise), then it will.  This "go paperless" campaign is all about money, not the environment.  

Bah, humbug, right?

Sunday, November 15, 2015

You Do The Math - Flat Tax Fair Tax

Every Republican candidate has their own tax plan.  Some say a 10% flat tax across the board is fair.  Some say a 20% flat tax is necessary to bring in enough revenue.  Some say no income tax at all, and just have a federal sales tax.  Well, today, you do the math.


FEDERAL SALES TAX

Lets get one tax plan out of the way first.  The national sales tax.  For anyone over 40 knows, a lot of your money is in savings or in retirement plans.  So...  you already paid taxes on it.  Do you want it taxed again?  At 25%?  Not on your life. So a flat sales tax is not fair to anyone who has saved over a dollar in their lives. Only people living in debt want a federal sales tax.  Like our youth.

Money in a Roth IRA already paid tax, and is a nice savings plan because it isn't subject to income tax when you finally take some distributions when you are older.  (Required distributions, by the way.  The feds force you to spend it or put it in a bank account.)   So, why pay a sales tax when you spend this already-taxed money?

Can you get a voucher on this money so you pay no tax?  Maybe a debit card with a faux starting balance, which is reduced at the point of sale.  Dang, that would cost billions to implement, like our new credit card machines for smart chips.  Maybe best to actually put your tax free money in a special account, put that on a debit card, and make it a smart chip card so it works seamlessly on the same device used for all other cards.  This would still require billions, but maybe a few billion less, since it will only be a software upgrade.

A regular IRA (non Roth IRA) has paid no federal tax yet.  Since this money came off the top of your income, it should have been taxed at the highest tax rate of your income that year.  But.... we're you paying 25% at the time you earned it? Maybe, maybe not.  Can you get a voucher to pay less sales tax?  A PARTIAL voucher, actually.

What about the poor who now pay no tax or maybe 5% or 10% on just half of their income?  Should they pay 25% on every dollar they spen? Perhaps they can get a voucher debit card has well.  At this rate,  ALL OUR MONEY WILL END UP IN A FEDERAL ACCOUNT!

It's a good thing that Social Security is a Ponze Scheme.  It's not actually a savings account, and wasn't taxed yet.  In fact, it IS tax.  It came off someone's income as tax, then gets turned around and given to retirees.   Then they pay tax on it as income!  Ridiculous.  That's like taxing your Roth IRA twice.

INCOME FLAT TAX

From my previous blog I calculated the total amount of income for America's wage earners.  This came to roughly 7.6 trillion dollars for the top fifth, and 6.7 trillion for the bottom four fifths.  The top fifth are averaging over 300 thousand dollars a year, while the next fifth averages 103 thousand, and the middle fifth 59 thousand, then 32 thousad, and finally, 13 thousand for the poorest fifth.


Total wages for the nation are 7.6 plus 6.7: 14.3 trillion.  A tax rate of 21% would come to 3 trillion dollars for federal coffers, which is less than Obama's peak expenditures of 3.5 trillion, but still more than the Bush budget pre bailout.

Because we are currently 18.5 trillion in debt, and will be 20.5 trillion in debt in 2 years by the time a new president's tax plan takes effect, we will probably have to spend half a trillion a year paying down the debt.  That leaves a budget of 2.5 trillion for other expenditures.  Which means we have to cut spending by half a trillion.

This assumes all other taxes are done away with, like the whopping 15% on each wage earner of a corporation.  There's also the 35% tax on corporate profits to consider.

In the table above, 19.8% is the average tax including all wage earners, from poorest to richest.  This made for revenues of 2.84 trillion.  Hence, an annual defecit still exists.  But this means that if a 15% employee tax existed, then federal revenues would be another 2.1 trillion dollars higher.

Then the feds would be running a huge surplus.  But they aren't!  There's a massive defecit each year.  Hmmmm...   Maybe the above chart includes the 15%?  Doubt it.  I know what the 1040 forms say, and the above tax rates are right in line with that.  Well, lets just forget that 15% business.  We don't want it anyway.

So, mathematically, only a 21% flat tax would work.  HOWEVER, is it fair to tax the poor a whopping 21% percent, when they are already paying 7% sales tax, 35 cents per gallon gas tax, property tax, and Lord knows what other taxes, forcing them to live on less money than it takes to pay rent?  No way.

But, is it fair to tax the six figure salary earner a little more?  Sure, they'll just spend their millions on yachts while their workers that earned all their company's money rot in small, sweltering apartments.

Below is the total money earned by all wage earners in each cagegory.


For a federal budget of 3 trillion dollars, its easy to see that taxing the top fifth at a rate of 50% would be more than enough.  However, if you did that, they would lower their salaries, and pay their workers more. (At least, that's how it happened in the past.)  Then revenues for the feds would drop.  I'm thinking that the one particular tax plan by a certain Republican candidate was the right idea.

Right now the personal deduction and exemption add up to over $9000, so you don't have to pay tax on anything under that.  But, that's not a living wage.  I like the idea of $35,000 being the lower limit. (I think that's Trump's plan.)  That way you can live on your horrible salary that your millionaire boss thinks you deserve.

Not only that, but the tax rate can be phased in at 1% increments, as it is now. Seriously, you can't just have a 0% tax then jump up immediately to 50%.

With this plan, only the third, fourth and top fifths will pay tax.  These salaries combined come to 1.988 trillion, 2.9 trillion and 7.6 trillion for each fifth, respectively.  That's a total of 12.5 trillion.

In order the get 3 trillion you need to average a tax rate of just under a fourth, which is 25%, and pretty high considering the average now is around 20%.

So, if the tax rate starts at 1%, it will have to eventually climb to 50% to average 25%.  Or will it?

No, it won't.  as salaries climb exponentially, the tax rate can simply climb  slowly at first, and maybe go high for those nut jobs who think they are worth 9.5  million a year.  Seriously, do they work a thousand hours a week?


It's a win, win, win, unless you are stinking, filthy rich.  They will be forced to live on a few million a year. So sad.